In this post, I’ll revisit my earlier model’s performance by experimenting with hyperparameter tuning, pushing beyond default configurations to extract deeper predictive power. I’ll also take a critical look at the data itself, exploring how winsorizing outliers can recalibrate outliers without sacrificing the integrity of the data. The goal: refine, rebalance, and rethink accuracy.
Hyperparameter Tuning
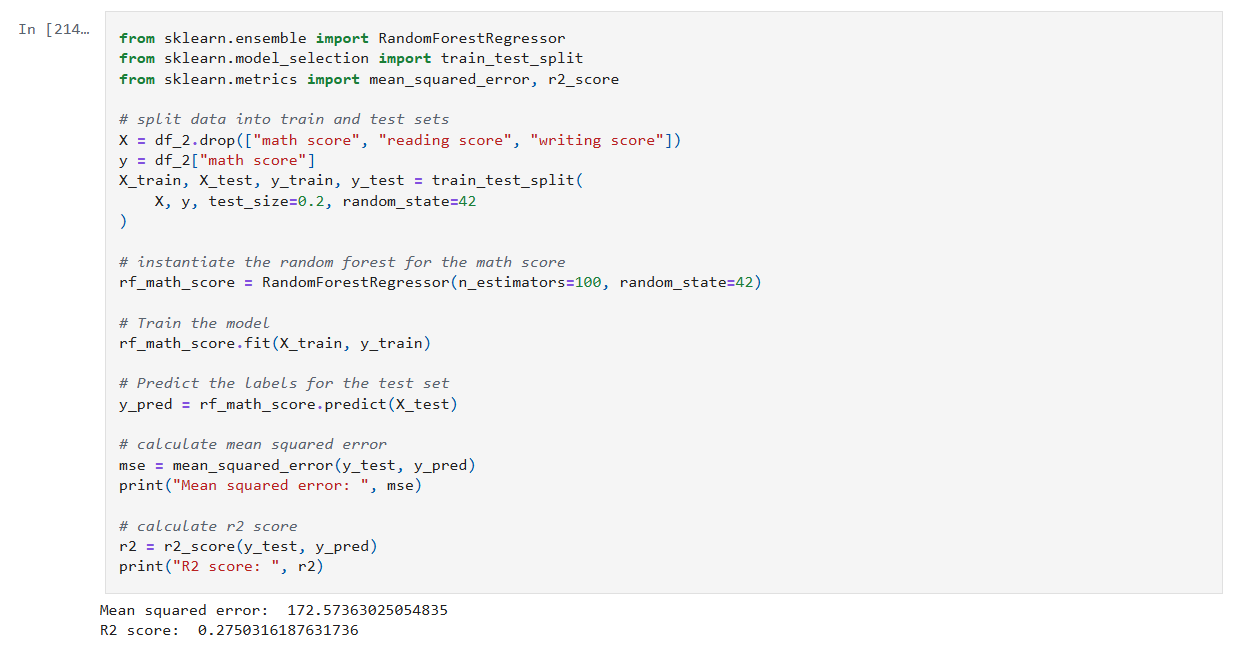
The image below shows my initial experiment with the RandomForestRegressor. As you can see, I used the default value for n_estimators.
The resulting MSE, RMSE and R² score are shown. In my earlier post I noted what those values mean. In summary:
- An MSE of 172 indicates there may be outliers.
- An RMSE of 13 indicates there an average error of around 13 points on 0–100 scale.
- An R² of 0.275 means my model explains just 27.5% of the variance in the target variable.

Experimentation
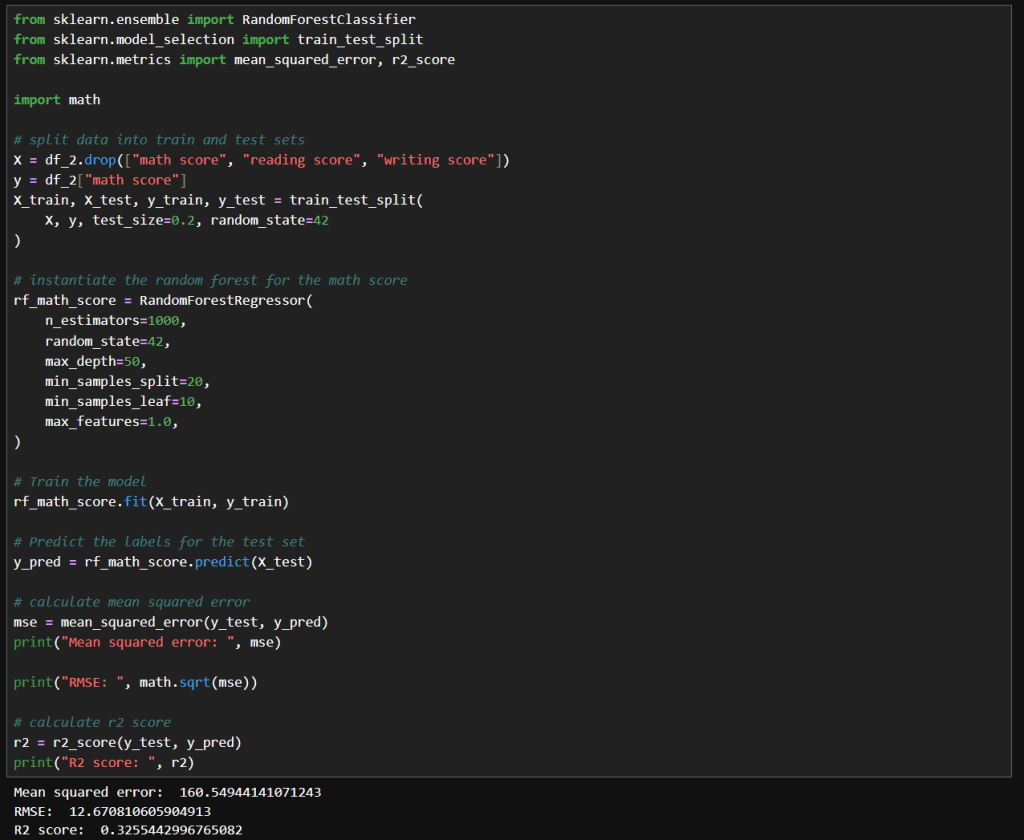
My first attempt at manual tuning looked like the image below. There really is just a small improvement with these parameters. I tried increasing n_estimators significantly because the accuracy should be improved with the larger value. I tried increasing max_depth to 50 to see if that compares to the default value of None. I tried increasing min_samples_split to 20 and min_samples_leaf of 10 to see if it would help with any noise in the data. I didn’t really need to set max_features to 1.0, because that is currently the default value.
The net result was slightly better results, but nothing too significant.
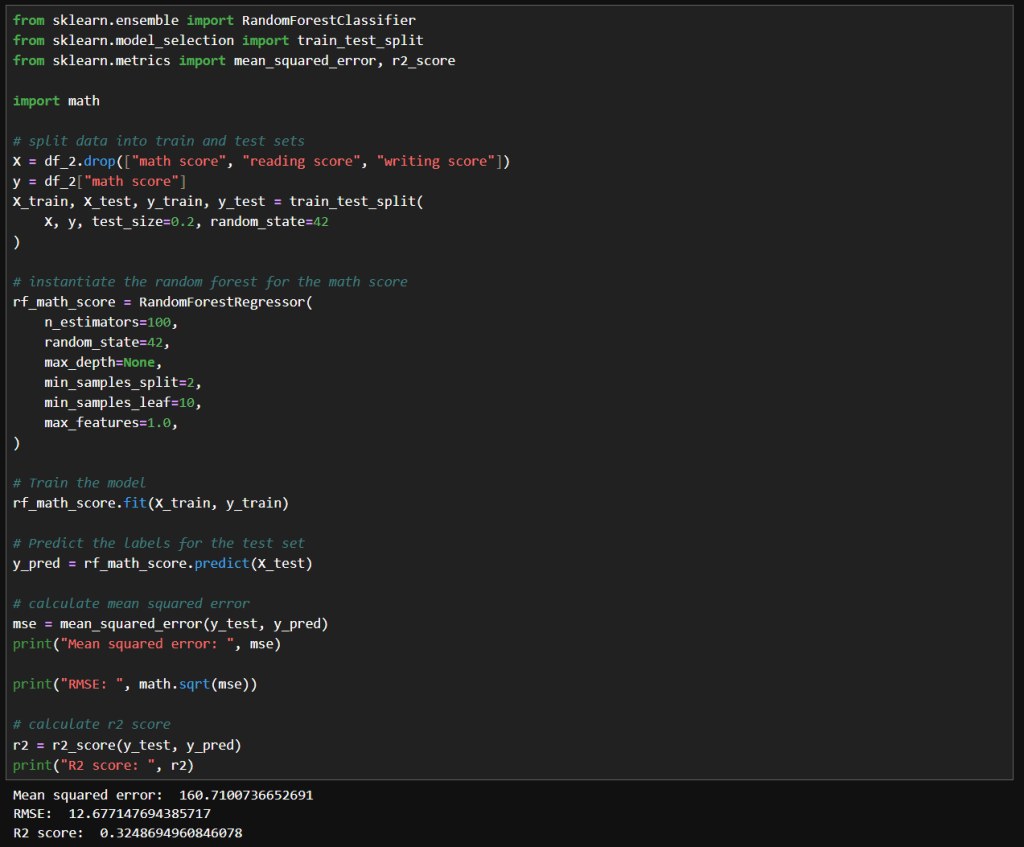
Next, I tried what is shown in the image below. Interestingly, I got very similar results to the above. With these values, the model trains much faster while achieving the same results.
Winsorizing
Winsorization changes a dataset by replacing outlier values with less extreme ones. Unlike trimming (which removes outliers), winsorization preserves the dataset size by limiting values at the chosen threshold.
Here is what my code looks like:

In this cell, I’ve replaced the math score data a winsorized version. I used the same hyperparameters as before. Here we can see a more significant improvement MSE and RMSE, but a slightly lower R² score.
That means that since the earlier model has a slightly higher R², it explains a bit more variance relative to the total variance of the target variable. Maybe because it models the core signal more tightly, even though it has noisier estimates.
The winsorized model, with its lower MSE and RMSE indicate better overall prediction accuracy. This is nice when minimizing absolute error matters the most.
Final Thoughts
After experimenting with default settings, I systematically adjusted hyperparameters and applied winsorization to improve my RandomForestRegressor’s accuracy. Here’s a concise overview of the three main runs:
- Deep, Wide Forest
- Parameters
- max_depth: 50
- min_samples_split: 20
- min_samples_leaf: 10
- max_features: 1.0
- random_state: 42
- Insights
- A large ensemble with controlled tree depth and higher split/leaf thresholds slightly reduced variance but yielded only marginal gains over defaults.
- Parameters
- Standard Forest with Unlimited Depth
- Parameters
- max_depth: None
- min_samples_split: 2
- min_samples_leaf: 10
- max_features: 1.0
- random_state: 42
- Insights
- Reverting to fewer trees and no depth limit produced nearly identical performance, suggesting diminishing returns from deeper or wider forests in this setting.
- Parameters
- Winsorized Data
- Parameters
- n_estimators: 100
- max_depth: None
- min_samples_split: 2
- min_samples_leaf: 10
- max_features: 1.0
- random_state: 42
- Applied winsorization to cap outliers
- Insights
- Winsorizing outliers drastically lowered absolute error (MSE/RMSE), highlighting its power for stabilizing predictions. The slight drop in R² reflects reduced target variance after capping extremes.
- Parameters
– William