Tag: Education Technology Trends

  • What I learned about the Gaussian Naive Bayes Classifier

    What I learned about the Gaussian Naive Bayes Classifier

    Description of Gaussian Naive Bayes Classifier

    Naive Bayes classifiers are simple supervised machine learning algorithms used for classification tasks. They are called “naive” because they assume that the features are independent of each other, which may not always be true in real-world scenarios. The Gaussian Naive Bayes classifier is a type of Naive Bayes classifier that works with continuous data. Naive Bayes classifiers have been shown to be very effective, even in cases where the the features aren’t independent. They can also be trained even with small datasets and are very fast once trained.

    Main Idea: The main idea behind the Naive Bayes classifier is to use Bayes’ Theorem to classify data based on the probabilities of different classes given the features of the data. Bayes’ Theorem says that we can tell how likely something is to happen, based on what we already know about something else that has already happened.

    Gaussian Naive Bayes: The Gaussian Naive Bayes classifier is used for data that has a continuous distribution and does not have defined maximum and minimum values. It assumes that the data is distributed according to a Gaussian (or normal) distribution. In a Gaussian distribution the data looks like a bell curve if it is plotted. This assumption lets us use the Gaussian probability density function to calculate the likelihood of the data. Below are the steps needed to train a classifier and then use to to classify a sample record.

    Steps to Calculate Probabilities (the hard way):

    1. Calculate the Averages (Means):
      • For each feature in the training data, calculate the mean (average) value.
      • To calculate the mean the sum of the values are divided by the number of values.
    2. Calculate the Square of the Difference:
      • For each feature in the training data, calculate the square of the difference between each feature value and the mean of that feature.
      • To calculate the square of the difference we subtract the mean from a value and square the result.
    3. Sum the Square of the Difference:
      • Sum the squared differences for each feature across all data points.
      • Calculating this is easy, we just add up all the squared differences for each feature.
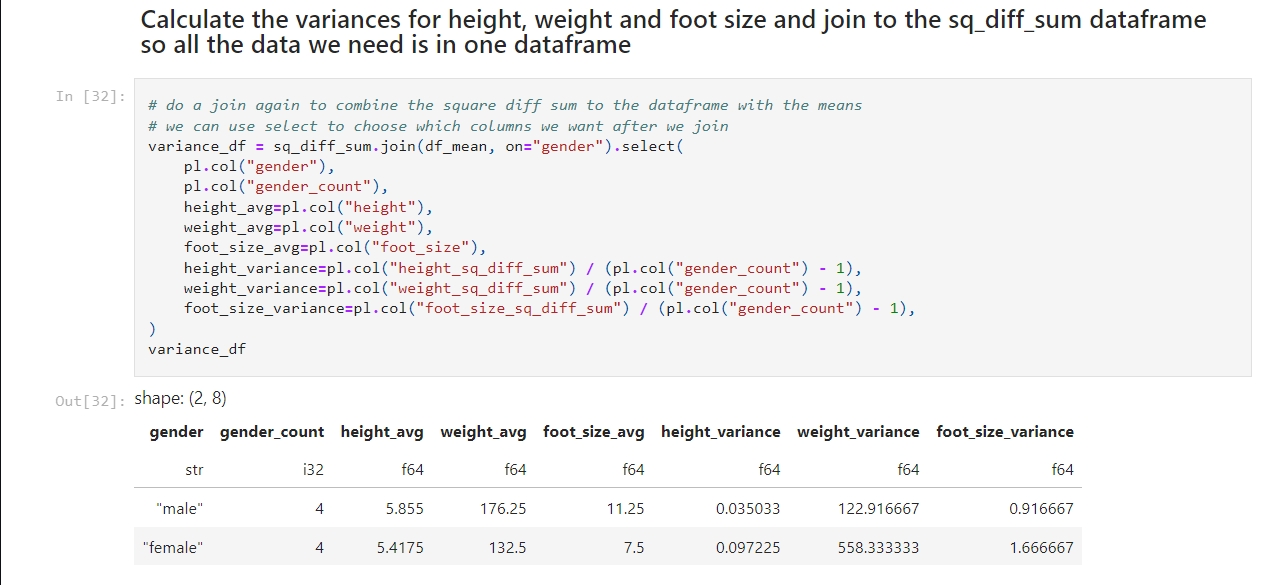
    4. Calculate the Variance:
      • Calculate the variance for each feature using the sum of the squared differences.
      • We calculate the variance by dividing the sum of the squares of the differences by the number of values minus 1.
    5. Calculate the Probability Distribution:
      • Use the Gaussian probability density function to calculate the probability distribution for each feature.
      • The formula for this is complicated! It goes like this:
        • First take: 1 divided by the square root of 2 times pi times the variance.
        • Multiply that by e to the power of -1 times the square of the value to test minus the mean of the value divided by 2 times the variance.
    6. Calculate the Posterior Numerators:
      • Calculate the posterior numerator for each class by multiplying the prior probability of the class with the probability distributions of each feature given the class.
    7. Classify the sample data:
      • The higher result from #6 is the result.

    I created a Jupyter notebook that performs these calculations based on this example I found on Wikipedia. Here is my notebook on GitHub. If you follow the instructions in my previous post you can run this notebook for yourself.

    – William

    References

    1. Wikipedia contributors. (2025, February 17). Naive Bayes classifier. In Wikipedia, The Free Encyclopedia. Retrieved from https://en.wikipedia.org/wiki/Naive_Bayes_classifier
    2. Wikipedia contributors. (2025, February 17). Variance: Population variance and sample variance. In Wikipedia, The Free Encyclopedia. Retrieved from https://en.wikipedia.org/wiki/Variance#Population_variance_and_sample_variance
    3. Wikipedia contributors. (2025, February 17). Probability distribution. In Wikipedia, The Free Encyclopedia. Retrieved from https://en.wikipedia.org/wiki/Probability_distribution
  • Initial Tool Selection and Setup

    Initial Tool Selection and Setup

    Installing Python on Windows

    The easiest way to install Python on Windows is to use the Windows Store, like this:

    1) Open a Command Prompt: Press the Windows and the S keys, then type cmd and press the Enter key.

    2) Install python: Type python in the command prompt and press the Enter key. This will open the Windows Store with the Python application. Click the install button to install Python.

    3) Check the installation: Run this command back in the command prompt: python --version

    Installing Key Libraries

    With Python installed, you can now install some essential data science libraries. Open Command Prompt or PowerShell and enter the following commands:

    1. Press the Windows button and the S button, type ‘cmd’ and hit enter to open a command shell.
    2. Now create a directory for this project, like C:\Projects\Jupyter, and change to that directory.
    3. Create a python virtual environment: python -m venv .venv
    4. Activate the virtual environment: .venv\scripts\activate
    5. To install polars: pip install polars
    6. To install Jupyter Lab: pip install jupyterlab
    7. To install Jupyter Notebook: pip install notebook
    8. We need to change the directory Jupyter uses to store it’s notebooks. To do that run this command in your Jupyter directory: jupyter notebook --generate-config
    9. The command will tell you where it created the configuration file. Open the file using Notepad and look for the line that has this: c.ServerApp.root_dir
    10. Uncomment the line by removing the # at the beginning of the line and change value to the Jupyter directory you created. The line should look like this: c.ServerApp.root_dir = 'C:\Work\Jupyter'
    11. Save and close the file.

    You can also install Black and use it to keep your code formatted like this:

    • Run this command: pip install black jupyter-black

    I’ll show how to use it in a notebook later.

    Note, you’ll need to run .venv\scripts\activate every time you open a new command shell.

    I’ve chosen to start off using Polars rather than Pandas because it is easy to use and much faster than Pandas.

    Creating and Running a Sample Jupyter Lab Notebook

    Now that you have your tools installed, let’s create and run a sample Jupyter Lab notebook:

    1) Open Jupyter Lab: In Command Prompt or PowerShell, activate the venv and then type: jupyter lab

    2) The URL to access the notebook is printed, so if it doesn’t open in your browser you can copy the address and go to it in your browser manually.

    3) Create a New Notebook: In Jupyter Lab, go to the Launcher tab and select “Python 3” under the Notebook section to create a new notebook.

    4) Add and Run Sample Code: In the new notebook, copy and paste the following code into a cell. You may need to remove the whitespace if you get an error:

    import polars as pl
    
    df = pl.DataFrame(
        {
            "foo": [1, 2, 3],
            "bar": [6, 7, 8],
            "ham": ["a", "b", "c"],
        }
    )
    
    df

    5) Run the Cell: Click the Run button (or press Ctrl + Enter) to execute the cell and see the output. You should see something that looks like this:

    shape: (3, 3)
    foo	bar	ham
    i64	i64	str
    1	6	"a"
    2	7	"b"
    3	8	"c"

  • Essential Tools and Services for My Data Science Learning Journey

    Essential Tools and Services for My Data Science Learning Journey

    Hello again, everyone! As I start on this journey into the world of data science, I want to share the tools and services I’ll be using. Each of these tools has features that make them valuable for data science applications. Let’s dive in and explore why they’re so valuable:

    GitHub.com

    GitHub is a web-based platform that allows developers to collaborate on code, manage projects, and track changes in their codebase using version control (Git). For data science, GitHub is incredibly useful because:

    • Collaboration: It lets me to collaborate with others on data science projects, share my work, and receive feedback from the community.
    • Version Control: I can keep track of changes in my code, experiment with different versions, and easily revert to previous states if needed.
    • Open-Source Projects: I can explore open-source data science projects, learn from others’ work, and contribute to the community.

    Kaggle.com

    Kaggle is a platform dedicated to data science and machine learning. It offers a wide range of datasets, competitions, and learning resources. Kaggle is a must-have for my journey because of its:

    • Datasets: Kaggle provides access to a vast collection of datasets across various domains, including education, which I plan to use for my projects.
    • Competitions: Participating in Kaggle competitions allows me to apply my skills to real-world problems, learn from others, and gain valuable experience.
    • Learning Resources: Kaggle offers tutorials, code notebooks, and forums where I can learn new techniques, ask questions, and improve my understanding of data science concepts.

    Python

    Python is a versatile and widely-used programming language in the data science community. Its popularity stems from several key features:

    • Readability: Python’s syntax is clean and easy to understand, making it an excellent choice for beginners.
    • Libraries: Python has many libraries and frameworks for data analysis, machine learning, and visualization, such as NumPy, pandas, and scikit-learn.
    • Community Support: The Python community is large and active, providing extensive documentation, tutorials, and forums to help me along my learning journey.

    Jupyter Labs

    Jupyter Labs is an interactive development environment that allows me to create and share documents containing live code, equations, visualizations, and narrative text. Its benefits for data science include:

    • Interactive Coding: I can write and execute code in small, manageable chunks, making it easier to test and debug my work.
    • Visualization: Jupyter Labs supports rich visualizations, enabling me to create and display graphs, charts, and plots within my notebooks.
    • Documentation: I can document my thought process, findings, and insights alongside my code, creating comprehensive and reproducible reports.

    Polars DataFrames

    Polars is a fast and efficient DataFrame library for Rust, which also has a Python interface. It is designed to handle large datasets and perform complex data manipulations. Polars is a valuable addition to my toolkit because of its:

    • Performance: Polars is optimized for performance, making it great for handling large datasets and performing computationally intensive tasks.
    • Memory Efficiency: It uses less memory compared to traditional DataFrame libraries, which will help when working with large data.
    • Flexible API: Polars provides a flexible and intuitive API that allows me to perform various data manipulation tasks, such as filtering, grouping, and aggregating data.

    Black

    Black is a code formatter for Python that ensures my code sticks to styling and readability standards. Black is an essential tool for my data science projects because of its:

    • Consistency: Black will automatically format my code to follow best practices, making it more readable and maintainable.
    • Efficiency: With Black taking care of formatting, I can focus on writing code and solving problems.
    • Integration: Black can be easily integrated with Jupyter Lab, so that my code remains consistently formatted within my notebooks.

    By leveraging these tools and services, I will be well-equipped to dive into the world of data science and tackle exciting projects. Stay tuned as I share my experiences and discoveries along the way!

    – William

  • First Post!

    First Post!

    My Journey into the Fascinating World of Data Science

    Inspiration Behind Starting This Blog

    Hello everyone! I’m William, a junior in high school who’s passionate about data science. Ever since I discovered data science, I’ve been fascinated by its potential to solve a myriad of problems. It’s amazing how data science can be applied in so many ways, from improving business strategies to enhancing healthcare. What truly drives me is the possibility of making a difference, starting with education. I have always enjoyed helping my friends with their schoolwork, and I believe that data science can provide powerful insights to improve educational outcomes. Hence, this blog is my way of documenting my journey and sharing my learnings with you.

    Goals of My Data Science Journey

    My primary goal is to learn all about data science—the diverse applications, methodologies, and algorithms that power this field. I want to gain a comprehensive understanding and apply what I learn to the realm of education. By leveraging data science, I aim to uncover insights that can contribute to making education more effective and accessible.

    What Drew Me to Data Science

    My interest in data science was sparked by the movie ‘Moneyball’. I watched it on an airplane, and it opened my eyes to the power of data analytics in sports. This led me to explore the world of data science further, and I discovered its applications stretch far beyond sports. From education to medicine, the possibilities are endless, and I couldn’t wait to dive in.

    Initial Steps

    Starting this journey requires some essential tools and a plan. From my research, I found that a great starting point is the Naive Bayes classifier. It’s a simple yet powerful algorithm that’s often recommended for beginners. Here’s my plan for my first set of blog posts:

    1. Tools and Services: I’ll share the tools and services I’ve learned are essential for data science, from coding environments to data visualization tools.
    2. Setup Steps: I’ll walk you through the steps I used to set up each of these tools, making it easy for you to follow along.
    3. First Algorithm to Learn: I’ll begin with the Naive Bayes classifier, a powerful and simple algorithm that’s great for classification tasks. I’ll provide a writeup of my understanding of the Naive Bayes classifier, breaking down the theory behind it.
    4. Use an Example from Wikipedia: I’ll follow an example I found on Wikipedia to implement the Naive Bayes classifier. That way I can be sure my code works as expected.
    5. Research Available Datasets: Next I’ll then research some education datasets, like on Kaggle.com, and pick one to continue my learning journey by showcasing a real-world application of the algorithm.
    6. Continue my Journey: Then I’ll decide the next algorithm to explore!

    Through this blog, I hope to share my learning experiences and provide valuable insights into the world of data science. Whether you’re a fellow student or someone interested in data science, join me as I explore the endless possibilities and applications of data science!

    Thank you for joining me on this adventure. Stay tuned as I delve deeper into the world of data science and share my experiences, discoveries, and insights with you.

    – William